Red Hat Observability Service
Red Hat Observability Service
Previous Documents:
What
Red Hat Observability Service (RHOBS) is a managed, centralized, multi-tenant, scalable backend for observability data. Functionally it is an internal deployment of Observatorium project. RHOBS is designed to allow ingesting, storing and consuming (visualisations, import, alerting, correlation) observability signals like metrics, logging and tracing.
This document provides the basic overview of the RHOBS service. If you want to learn about RHOBS architecture, look for Observatorium default deployment and its design.
Background
With the amount of managed Openshift clusters, for Red Hat’s own use as well as for customers, there is a strong need to improve the observability of those clusters and of their workloads to the multi-cluster level. Moreover, with the “clusters as cattle” concept, more automation and complexity there is a strong need for a uniform service gathering observability data including metrics, logs, traces, etc into a remote, centralized location for multi-cluster aggregation and long term storage.
This need is due to many factors:
- Managing applications running on more than one cluster, which is a default nowadays (cluster as a cattle),
- Need to offload data and observability services from edge cluster to reduce complexity and cost of edge cluster (e.g remote health capabilities).
- Allow offloading teams from maintaining their own observability service.
It’s worth noting that there is also a significant benefit to collecting and using multiple signals within one system:
- Correlating signals and creating a smooth and richer debugging UX.
- Sharing common functionality, like rate limiting, retries, auth, etc, which allows a consistent integration and management experience for users.
The Openshift Monitoring Team began preparing for this shift in 2018 with the Telemeter Service. In particular, while creating the second version of the Telemeter Service, we put effort into developing and contributing to open source systems and integration to design “Observatorium”: a multi-signal, multi-tenant system that can be operated easily and cheaply as a Service either by Red Hat or on-premise. After extending the scope of the RHOBS, Telemeter become the first “tenant” of the RHOBS.
In Summer 2020, the Monitoring Team together with the OpenShift Logging Team added a logging signal to “Observatorium” and started to manage it for internal teams as the RHOBS.
Current Usage
RHOBS is running in production and has already been offered to various internal teams, with more extensions and expansions coming in the near future.
- There is currently no plan to offer RHOBS to external customers.
- However anyone is welcome to deploy and manage an RHOBS-like-service on their own using Observatorium.
Usage (state as of 2021.07.01):
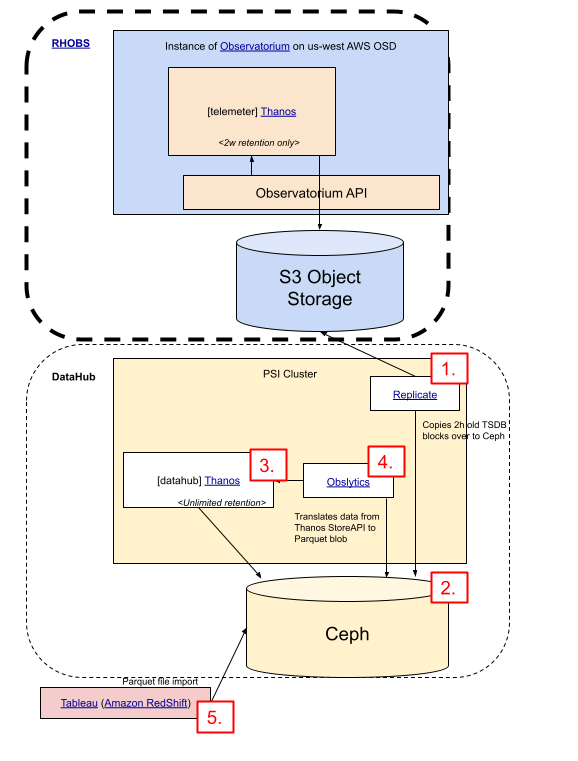
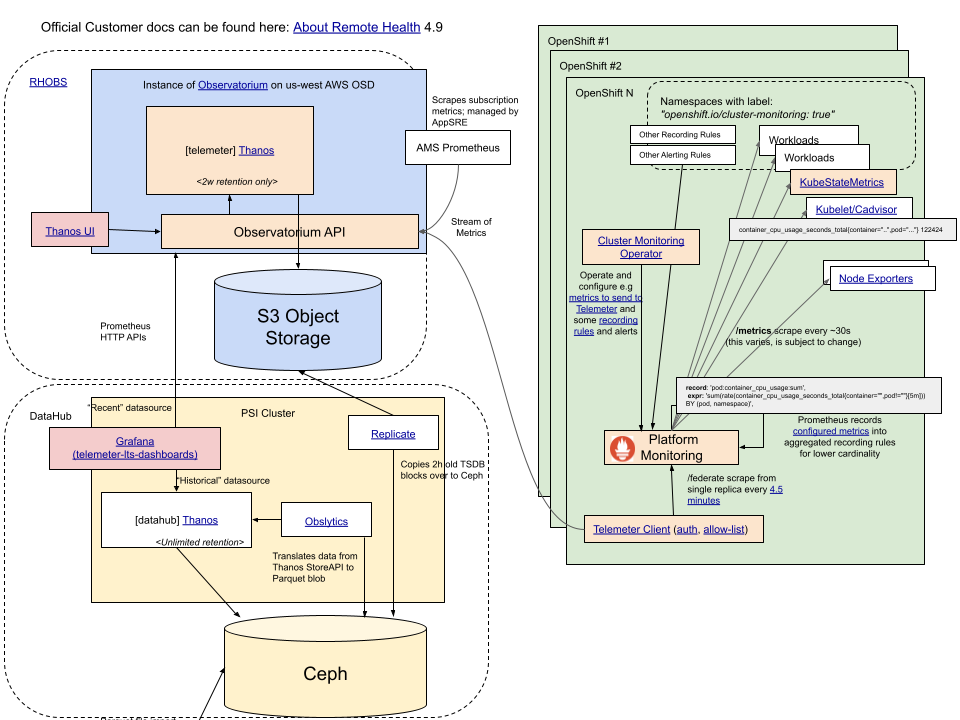
The metric usage is visualised in the following diagram:
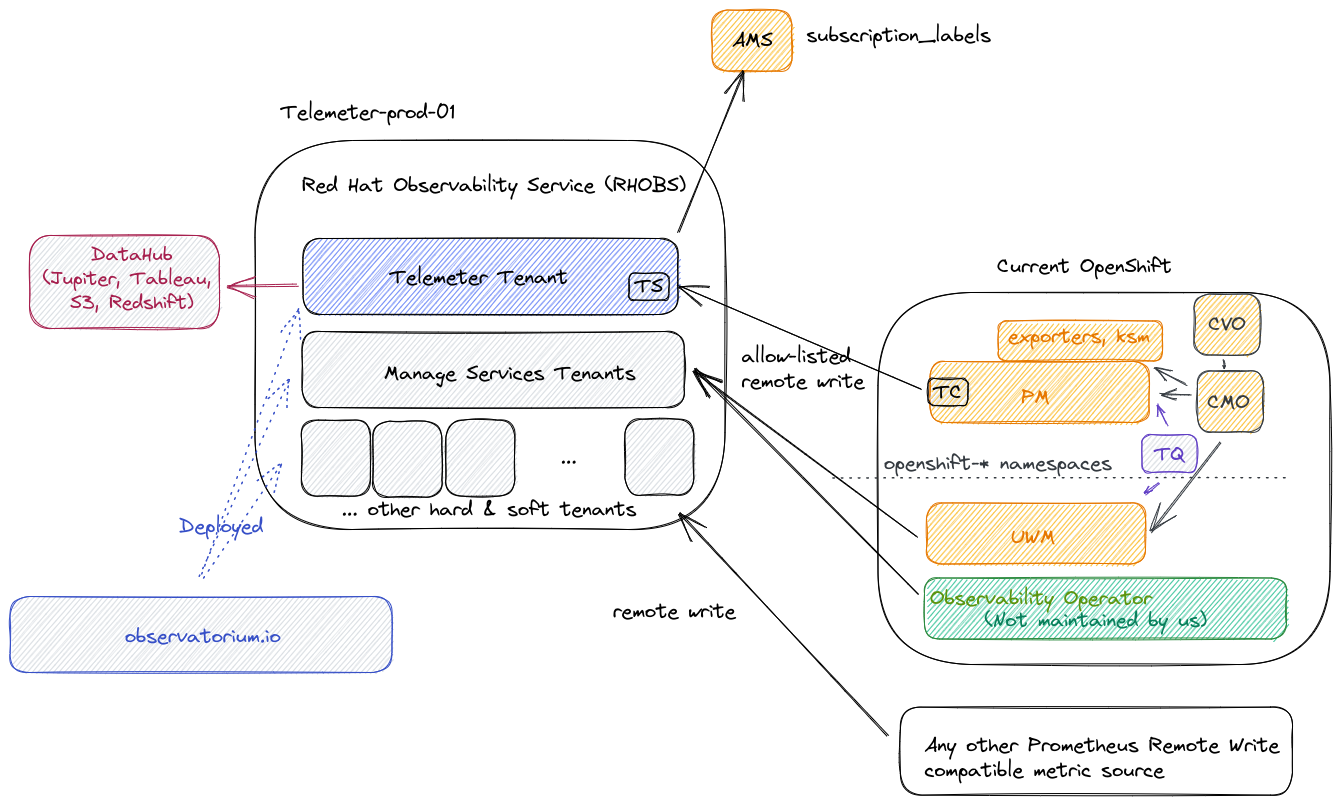
RHOBS is functionally separated into two main usage categories:
- Since 2018 we run Telemeter tenant for metric signal (hard tenancy,
telemeter-prod-01 cluster). See telemeter for details.
- Since 2021 we ingest metrics for selected Managed Services as soft tenants in an independent deployment (separate soft tenant,
telemeter-prod-01 cluster). See MST for details.
Other signals:
- Since 2020 we ingest logs for the DPTP team (hard tenancy,
telemeter-prod-01 cluster).
Hard vs Soft tenancy: In principle hard tenancy means that in order to run system for multiple tenants you run each stack (can be still in single cluster, yet isolated through e.g namespaces) for each tenant. Soft tenancy means that we reuse same endpoint and services to handle tenant APIs. For tenant both tenancy models should be invisible. We chose Telemeter to be deployed in different stack, because of Telemeter critical nature and different functional purpose that makes Telemeter performance characteristics bit different to normal monitoring setup (more analytics-driven cardinality).
Owners
RHOBS was initially designed by Monitoring Group and its metric signal is managed and supported by Monitoring Group team (OpenShift organization) together with AppSRE team (Service Delivery organization).
Other signals are managed by others team (each together with AppSRE help):
- Logging signal: OpenShift Logging Team
- Tracing signal: OpenShift Tracing Team
Telemeter part client side is maintained by In-cluster Monitoring team, but managed by corresponding client cluster owner.
Metric Label Restrictions
There is small set of reserved label name that are reserved on RHOBS side. If remote write request contains series with those labels, they will be overridden (not honoured).
Restricted labels:
tenant_id: Internal tenant ID in form of UUID that is injected to all series in various placed and constructed from tenant authorization (HTTP header).receive: Special label used internally.replica and rule_replica: Special label used internally to replicate receive and rule data for reliability.
Special labels:
prometheus_replica: Use this label for Agent/Prometheus unique scraper ID if you scrape and push from multiple of replicas scraping the same data. RHOBS is configured to deduplicate metrics based on this.
Recommended labels:
_id for cluster ID (in form of lowercase UUID) is the common way of identifying clusters.prometheus is a name of Prometheus (or any other scraper) that was used to collect metrics.job is scrape job name that is usually dynamically set to abstracted service name representing microservice (usually deployment/statefulset name)namespace is Kubernetes namespace. Useful to make sure identify same microservices across namespaces.- For more “version” based granularit (warning - every pod rollout creates new time series).
pod is a pod nameinstance is an IP:port (useful when pod has sidecars)image is image name and tag.
Support
For support see:
2 - Configuring Clients for Red Hat’s Observatorium Instance
Configuring Clients for Red Hat’s Observatorium Instance
Overview
Teams that have identified a need for collecting their logs and/or metrics into a centralized service that offers querying and dashboarding may choose to send their data to Red Hat’s hosted Observatorium instance. This document details how to configure clients, such as Prometheus, to remote write data for tenants who have been onboarded to Observatorium following the team’s onboarding doc: Onboarding a Tenant into Observatorium (internal).
Before configuring any clients, follow the steps in the Observatorium Tenant Onboarding doc (internal) to register the necessary service accounts and give them the required permissions on the Observatorium platform. The result of this process should be an OAuth client ID and client secret pair for each new service account. Save these credentials somewhere secure.
1. Remote Writing Metrics to Observatorium
Using the Cluster Monitoring Stack
This section describes the process of sending metrics collected by the Cluster Monitoring stack on an OpenShift cluster to Observatorium.
Background
In order to remote write metrics from a cluster to Observatorium using the OpenShift Cluster Monitoring stack, the cluster’s Prometheus servers must be configured to authenticate and make requests to the correct URL. The OpenShift Cluster Monitoring ConfigMap exposes a user-editable field for configuring the Prometheus servers to remote write. However, because Prometheus does not support OAuth, it cannot authenticate directly with Observatorium and because the Cluster Monitoring stack is, for all intents and purposes, immutable, the Prometheus Pods cannot be configured with sidecars to do the authentication. For this reason, the Prometheus servers must be configured to remote write through an authentication proxy running on the cluster that in turn is pointed at Observatorium and is able to perform an OAuth flow and set the received access token on proxied requests.
The OpenShift Cluster Monitoring stack provides a ConfigMap that can be used to modify the configuration and behavior of the components. The first step is to modify the “cluster-monitoring-config” ConfigMap in the cluster to include a remote write configuration for Prometheus as shown below:
apiVersion: v1
kind: ConfigMap
metadata:
  name: cluster-monitoring-config
  namespace: openshift-monitoring
data:
  config.yaml: |
    prometheusK8s:
      retention: 2h
      remoteWrite:
      - url: http://token-refresher.openshift-monitoring.svc.cluster.local
        queueConfig:
          max_samples_per_send: 500
          batch_send_deadline: 60s
        write_relabel_configs:
          - source_labels: [__name__]
          - regex: metric_name.*
2. Deploy the Observatorium Token-Refresher Proxy
Because Prometheus does not have built-in support for acquiring OAuth2 access tokens for authorization, which are required by Observatorium, the in-cluster Prometheus must remote write its data through a proxy that is able to fetch access tokens and set them as headers on outbound requests. The Observatorium stack provides such a proxy, which may be deployed to the “openshift-monitoring” namespace and guarded by a NetworkPolicy so that only Prometheus can use the access tokens. The following snippet shows an example of how to deploy the proxy for the stage environment:
export TENANT=<your-tenant>
export CLIENT_ID=<your-client-id>
export CLIENT_SECRET=<your-client-secret>
# For staging:
export STAGING=true
cat <<EOF | oc apply -f -
apiVersion: v1
kind: Secret
metadata:
  labels:
    app.kubernetes.io/component: authentication-proxy
    app.kubernetes.io/name: token-refresher
  name: token-refresher
  namespace: openshift-monitoring
type: Opaque
stringData:
  CLIENT_ID: $CLIENT_ID
  CLIENT_SECRET: $CLIENT_SECRET
  ISSUER_URL: https://sso.redhat.com/auth/realms/redhat-external
  URL: "https://observatorium-mst.api$([ -n "$STAGING" ] && echo .stage).openshift.com/api/metrics/v1/$TENANT/api/v1/receive"
---
apiVersion: v1
kind: Service
metadata:
  labels:
    app.kubernetes.io/component: authentication-proxy
    app.kubernetes.io/name: token-refresher
    app.kubernetes.io/version: master-2020-12-04-5504078
  name: token-refresher
  namespace: openshift-monitoring
spec:
  ports:
    - name: http
      port: 80
      targetPort: 8080
  selector:
    app.kubernetes.io/component: authentication-proxy
    app.kubernetes.io/name: token-refresher
---
apiVersion: apps/v1
kind: Deployment
metadata:
  labels:
    app.kubernetes.io/component: authentication-proxy
    app.kubernetes.io/name: token-refresher
    app.kubernetes.io/version: master-2020-12-04-5504078
  name: token-refresher
  namespace: openshift-monitoring
spec:
  replicas: 1
  selector:
    matchLabels:
      app.kubernetes.io/component: authentication-proxy
      app.kubernetes.io/name: token-refresher
  template:
    metadata:
      labels:
        app.kubernetes.io/component: authentication-proxy
        app.kubernetes.io/name: token-refresher
        app.kubernetes.io/version: master-2020-12-04-5504078
    spec:
      containers:
      - args:
        - --oidc.audience=observatorium-telemeter
        - --oidc.client-id=\$\(CLIENT_ID\)
        - --oidc.client-secret=\$\(CLIENT_SECRET\)
        - --oidc.issuer-url=\$\(ISSUER_URL\)
        - --url=\$\(URL\)
        env:
        - name: CLIENT_ID
          valueFrom:
            secretKeyRef:
              name: token-refresher
              key: CLIENT_ID
        - name: CLIENT_SECRET
          valueFrom:
            secretKeyRef:
              name: token-refresher
              key: CLIENT_SECRET
        - name: ISSUER_URL
          valueFrom:
            secretKeyRef:
              name: token-refresher
              key: ISSUER_URL
        - name: URL
          valueFrom:
            secretKeyRef:
              name: token-refresher
              key: URL
        image: quay.io/observatorium/token-refresher:master-2021-02-24-1e01b9c
        name: token-refresher
        ports:
        - containerPort: 8080
          name: http
---
apiVersion: networking.k8s.io/v1
kind: NetworkPolicy
metadata:
  labels:
    app.kubernetes.io/component: authentication-proxy
    app.kubernetes.io/name: token-refresher
  name: token-refresher
  namespace: openshift-monitoring
spec:
  podSelector:
    matchLabels:
      app.kubernetes.io/component: authentication-proxy
      app.kubernetes.io/name: token-refresher
  policyTypes:
  - Ingress
  ingress:
  - from:
    - podSelector:
        matchLabels:
          prometheus: k8s
EOF
Using a Self-Managed Prometheus Server
This section describes the process of sending metrics collected by a Prometheus server to Observatorium.
Background
In order to remote write metrics from a Prometheus server to Observatorium, the server must be configured to authenticate and make requests to the correct URL using the remote_write section of the Prometheus configuration file. Prometheus needs to be configured to use OAuth2 for authenticating the remote write requests to Observatorium. This can be done by setting appropriate fields in the oauth2 section under remote_write.
NOTE: OAuth2 support was added to Prometheus in version 2.27.0. If using an older version of Prometheus without native OAuth2 support, the remote write traffic needs to go through a proxy such as token-refresher, similar to what is described above for Cluster Monitoring Stack.
1. Modify the Prometheus configuration
The configuration file for Prometheus must be patched to include a remote write configuration as shown below. <tenant>, <client_id>, and <client_secret> need to be replaced with appropriate values.
remote_write:
  - url: https://observatorium-mst.api.stage.openshift.com/api/metrics/v1/<tenant>/api/v1/receive
    oauth2:
      client_id: <client_id>
      client_secret: <client_secret>
      token_url: https://sso.redhat.com/auth/realms/redhat-external/protocol/openid-connect/token
4 - Rules and alerting capabilities
Rules and alerting capabilities
Overview
As explained in more details here, RHOBS features a deployment of Observatorium.
Through the Observatorium API, tenants are able to create, read, update and delete their own Prometheus recording and alerting rules via the Observatorium Rules API.
In addition to this, each of the RHOBS instances has an Alertmanager deployed, which makes possible for tenants to configure custom alert routing configuration to route firing alerts to their specified receivers.
Goal
This page aims to provide a simple tutorial of how a tenant can create an alerting rule via the Observatorium Rules API and configure Alertmanager properly to get alerted via a desired receiver.
For this tutorial we will be using the rhobs tenant in the MST stage environment. URLs may change slightly in case another tenant is used.
Authenticate against the Observatorium API
To have access to the Observatorium API, the tenant making the requests needs to be correctly authenticated. For this you can install obsctl which is a dedicated CLI tool to interact with Observatorium instances as tenants. It uses the provided credentials to fetch OAuth2 access tokens via OIDC and saves both the token and credentials for multiple tenants and APIs, locally.
You can get up and running quickly with the following steps,
-
Make sure you have Go 1.17+ on your system and install obsctl,
go install github.com/observatorium/obsctl@latest
-
Add your desired Observatorium API,
obsctl context api add --name='staging-api' --url='https://observatorium-mst.api.stage.openshift.com'
-
Save credentials for a tenant under the API you just added (you will need your own OIDC Client ID, Client Secret & TENANT),
obsctl login --api='staging-api' --oidc.audience='observatorium' --oidc.client-id='<CLIENT_ID>' --oidc.client-secret='<SECRET>' --oidc.issuer-url='https://sso.redhat.com/auth/realms/redhat-external' --tenant='<TENANT>'
-
Verify that you are using the correct API + tenant combination or “context” (in this case it would be staging-api/rhobs),
For this tutorial we will be using https://observatorium-mst.api.stage.openshift.com as our target Observatorium API.
Now that we have set up obsctl, let’s start creating an alerting rule.
Create an alerting rule
A tenant can create and list recording and alerting rules via the Observatorium Rules API. For this tutorial we will be creating an alerting rule, to also make use of the alerting capabilities that are available in Observatorium.
If you want to get more details about how to interact with the Rules API and its different endpoints, refer to the upstream documentation or OpenAPI spec.
In your local environment, create a Prometheus alerting rule YAML file with the definition of the alert you want to add. Note that the file should be defined following the Observatorium OpenAPI specification. The file should be in Prometheus recording and/or alerting rules format.
For example, you can create a file named alerting-rule.yaml:
groups:
- interval: 30s
  name: test-firing-alert
  rules:
  - alert: TestFiringAlert
    annotations:
      dashboard: https://grafana.stage.devshift.net/d/Tg-mH0rizaSJDKSADX/api?orgId=1&refresh=1m
      description: Test firing alert
      message: Message of firing alert here
      runbook: https://github.com/rhobs/configuration/blob/main/docs/sop/observatorium.md
      summary: Summary of firing alert here
    expr: vector(1)
    for: 1m
    labels:
      severity: page
Now to set this rule file, you can use obsctl,
obsctl metrics set --rule.file=/path/to/alerting-rule.yaml
obsctl uses the credentials you saved earlier, to make an authenticated application/yaml PUT request to the api/v1/rules/raw endpoint of the Observatorium API, which creates your alerting rule.
obsctl should print out the response, which, if successful, would be: successfully updated rules file.
Besides checking this response, you can also list or read the configured rules for your tenant by,
obsctl metrics get rules.raw
This would make a GET request to api/v1/rules/raw endpoint and return the rules you configured in YAML form. This endpoint will immediately reflect any newly set rules.
Note that in the response a tenant_id label for the particular tenant was added automatically. Since Observatorium API is tenant-aware, this extra validation step is also performed. Also, in the case of rules expressions, the tenant_id labels are injected into the PromQL query, which ensures that only data from a specific tenant is selected during evaluation.
You can also check your rule’s configuration, health, and resultant alerts by,
This would make a GET request to api/v1/rules endpoint, and return rules you configured in Prometheus HTTP API format JSON response. You can read more about checking rule state here.
Note that this endpoint does not reflect newly set rules immediately and might take up to a minute to sync.
How to update and delete an alerting rule
As mentioned in the upstream docs that each time a PUT request is made to the /api/v1/rules/raw endpoint, the rules contained in the request will overwrite all the other rules for that tenant. Thus, each time you use obsctl metrics set --rule.file=<file> it will overwrite all other rules for a tenant with the new rule file.
Make sure to grab your existing rules YAML file and append any new rules or groups you want to create, to this file.
Using the example above, in case you want to create a second alerting rule, a new alert rule should be added to the file,
groups:
- interval: 30s
  name: test-firing-alert
  rules:
  - alert: TestFiringAlert
    annotations:
      dashboard: https://grafana.stage.devshift.net/d/Tg-mH0rizaSJDKSADX/api?orgId=1&refresh=1m
      description: Test firing alert!!
      message: Message of firing alert here
      runbook: https://github.com/rhobs/configuration/blob/main/docs/sop/observatorium.md
      summary: Summary of firing alert here
    expr: vector(1)
    for: 1m
    labels:
      severity: page
- interval: 30s
  name: test-new-firing-alert
  rules:
  - alert: TestNewFiringAlert
    annotations:
      dashboard: https://grafana.stage.devshift.net/d/Tg-mH0rizaSJDKSADX/api?orgId=1&refresh=1m
      description: Test new firing alert!!
      message: Message of new firing alert here
      runbook: https://github.com/rhobs/configuration/blob/main/docs/sop/observatorium.md
      summary: Summary of new firing alert here
    expr: vector(1)
    for: 1m
    labels:
      severity: page
And then this new file can be set via obsctl metrics set --rule.file=/path/to/alerting-rule.yaml to update your rules configuration.
Similarly, if you want to delete a rule, you can remove that from your existing rule file, before setting it with obsctl.
If you want to delete all rule(s) for a tenant, you can run obsctl metrics set --rule.file= with an empty file.
Sync rules from your cluster
Alternatively, you can choose to sync rules from your cluster to Observatorium Rules API via prometheus-operator’s PrometheusRule CRD.
Create PrometheusRule objects in your cluster containing your desired rules (you can even create multiple). Ensure that you have a tenant label specifying your tenant in metadata.labels like below,
apiVersion: monitoring.coreos.com/v1
kind: PrometheusRule
metadata:
  labels:
    tenant: rhobs
  name: obsctl-reloader-example
spec:
  groups:
  - interval: 30s
    name: test-firing-alert
    rules:
    - alert: TestFiringAlert
      annotations:
        dashboard: https://grafana.stage.devshift.net/d/Tg-mH0rizaSJDKSADX/api?orgId=1&refresh=1m
        description: Test firing alert!!
        message: Message of firing alert here
        runbook: https://github.com/rhobs/configuration/blob/main/docs/sop/observatorium.md
        summary: Summary of firing alert here
      expr: vector(1)
      for: 1m
      labels:
        severity: page
  - interval: 30s
    name: test-new-firing-alert
    rules:
    - alert: TestNewFiringAlert
      annotations:
        dashboard: https://grafana.stage.devshift.net/d/Tg-mH0rizaSJDKSADX/api?orgId=1&refresh=1m
        description: Test new firing alert!!
        message: Message of new firing alert here
        runbook: https://github.com/rhobs/configuration/blob/main/docs/sop/observatorium.md
        summary: Summary of new firing alert here
      expr: vector(1)
      for: 1m
      labels:
        severity: page
Once the rules are present in a namespace, you can run a obsctl-reloader deployment to sync these rules to Observatorium. Images can be found at https://quay.io/repository/app-sre/obsctl-reloader.
You can create a deployment using example OpenShift template with correct K8s RBAC. Ensure that you specify your OIDC credentials, tenant name and cluster namespace containing PrometheusRules, as environment variables,
...
  spec:
    replicas: 1
    selector:
      matchLabels:
        app.kubernetes.io/component: obsctl-reloader
        app.kubernetes.io/instance: obsctl-reloader
        app.kubernetes.io/name: obsctl-reloader
    template:
      metadata:
        labels:
          app.kubernetes.io/component: obsctl-reloader
          app.kubernetes.io/instance: obsctl-reloader
          app.kubernetes.io/name: obsctl-reloader
          app.kubernetes.io/version: latest
      spec:
        containers:
        - env:
          - name: NAMESPACE_NAME
            valueFrom:
              fieldRef:
                fieldPath: metadata.namespace
          - name: OBSERVATORIUM_URL
            value: https://observatorium-mst.api.stage.openshift.com
          - name: OIDC_AUDIENCE
            value: observatorium
          - name: OIDC_ISSUER_URL
            value: https://sso.redhat.com/auth/realms/redhat-external
          - name: SLEEP_DURATION_SECONDS
            value: 15
          - name: MANAGED_TENANTS
            value: rhobs
          - name: OIDC_CLIENT_ID
            valueFrom:
              secretKeyRef:
                key: client_id
                name: ${TENANT_SECRET}
          - name: OIDC_CLIENT_SECRET
            valueFrom:
              secretKeyRef:
                key: client_secret
                name: ${TENANT_SECRET}
          image: quay.io/app-sre/obsctl-reloader:a9daddf
          imagePullPolicy: IfNotPresent
          name: obsctl-reloader
        serviceAccountName: obsctl-reloader
Keep in mind that all the PrometheusRule CRDs are combined to a single rule file by obsctl-reloader. Also, note that the obsctl-reloader project is still experimental, and needs to be deployed by the tenant.
Create a routing configuration in Alertmanager
Now that the alerting rule is correctly created, you can start to configure Alertmanager.
Create a merge request to app-interface/resources/rhobs:
- Choose the desired environment (
production/stage) folder. For this tutorial, we will be using the stage environment.
- Modify the
alertmanager-routes-<instance>-secret.yaml file with the desired configuration.
- After changing the file, open a merge request with the updated configuration file.
The alertmanager-routes-<instance>-secret.yaml already contains basic configuration, such as a customized template for slack notifications and a few receivers. For this tutorial, a slack-monitoring-alerts-stage receiver was configured with a route matching the rhobs tenant_id:
routes:
- matchers:
  - tenant_id = 0fc2b00e-201b-4c17-b9f2-19d91adc4fd2
  receiver: slack-monitoring-alerts-stage
For more information about how to configure Alertmanager, check out the official Alertmanager documentation.
Check the alerting rule state
It is possible to check all rule groups for a tenant by querying /api/v1/rules endpoint (i.e by running obsctl metrics get rules). /api/v1/rules supports only GET requests and proxies to the upstream read endpoint (in this case, Thanos Querier).
This endpoint returns the processed and evaluated rules from Observatorium’s Thanos Rule in Prometheus HTTP API format JSON.
It is different from api/v1/rules/raw endpoint (which can be queried by running obsctl metrics get rules.raw) in a few ways,
api/v1/rules/raw only returns the unprocessed/raw rule file YAML that was configured whereas api/v1/rules returns processed JSON rules with health and alert data.api/v1/rules/raw immediately reflects changes to rules, whereas api/v1/rules can take up to a minute to sync with new changes.
Thanos Ruler evaluates the Prometheus rules - in this case for example, it checks which alerting rules will be triggered, the last time they were evaluated and more.
For example, if TestFiringAlert is already firing, the response will contain a "state": "firing" entry for this alert:
"alerts": [
  {
    "labels": {
      "alertname": "TestFiringAlert",
      "severity": "page",
      "tenant_id": "0fc2b00e-201b-4c17-b9f2-19d91adc4fd2"
    },
    "annotations": {
      "dashboard": "https://grafana.stage.devshift.net/d/Tg-mH0rizaSJDKSADX/api?orgId=1&refresh=1m",
      "description": "Test firing alert",
      "message": "Message of firing alert here",
      "runbook": "https://github.com/rhobs/configuration/blob/main/docs/sop/observatorium.md",
      "summary": "Summary of firing alert here"
    },
    "state": "firing",
    "activeAt": "2022-03-02T10:13:39.051462148Z",
    "value": "1e+00",
    "partialResponseStrategy": "ABORT"
  }
],
If the alert has already the "state": "firing" entry, with the Alertmanager having the routing configuration for a specific receiver (in our case, slack), it should be possible to see the alert showing up on slack, in the configured slack channel.
In case you want to configure a receiver (e.g. slack, pagerduty) to receive alert notifications, it is likely necessary that you’d need to provide secrets so that Alertmanager has push access to. Currently, you have to store the desired secrets in Vault and embed them via app-sre templating. Refer to https://vault.devshift.net/ui/vault/ to create a new secret or to retrieve an existing one. You can them embed this secret in your Alertmanager configuration file using the following syntax:
{{{ vault('app-sre/integrations-input/alertmanager-integration', 'slack_api_url') }}}
Where app-sre/integrations-input/alertmanager-integration is the path of the stored secret in Vault and slack_api_url is the key.
You can refer to the app-interface documentation to get more information about this.
Once your MR is merged with the desired Alertmanager configuration, the configuration file is reloaded by the Observatorium Alertmanager instances. To get your MR merged an approval from app-sre is necessary.
Testing the route configuration
If you want to test your Alertmanager configuration to verify that the configured receivers are receiving the right alert, we recommend the use of amtool.
Note that the original configuration file in app-interface is a file of type Secret. In this case, you should aim to test the data what is under alertmanager.yaml key. There may be also app-interface specific annotation (e.g. how the slack_url is constructed by retrieving a Vault secret) - which may prompt the validation by amtool to fail.
After installing amtool correctly, you can check the configuration of the alertmanager.yaml file with:
amtool check-config alertmanager.yaml
It is also possible to check the configuration against specific receivers.
For our example, we have slack-monitoring-alerts-stage receiver configured.
To check that the configured route matches the RHOBS tenant_id, we can run:
amtool config routes test --config.file=alertmanager.yaml --verify.receivers=slack-monitoring-alerts-stage tenant_id=0fc2b00e-201b-4c17-b9f2-19d91adc4fd2
Summary
After this tutorial, you should be able to:
- Create an alerting rule through Observatorium Rules API.
- Setup Observatorium Alertmanager instances with the desired routing configuration.
- Check that the integration works properly on the configured receiver.
Additional resources
In case problems occur or if you want to have a general overview, here is a list of links that can help you:
Note: As of today, tenants are unable to access the Alertmanager UI. Please reach out to @observatorium-support in the #forum-observatorium to get help if needed.